We recently had a staff meeting and were discussing our ACL Vald metric data and how we interpret it for our patients. As you know, there’s a ton of research on ACL rehab, but not a lot that actually tells you what’s happening week to week and across the full first year in the same group of patients.
Most studies give you a snapshot, usually around return to sport, and you’re left trying to piece together the trajectory on your own. This paper from Dutaillis and colleagues out of Griffith University in Australia is pretty neat and clinically applicable.
They tracked 30 athletes at 3, 6, 9, and 12 months post-ACLR, measuring strength, jump performance, and patient-reported outcomes at every time point. It’s not a perfect study, but it’s one of the more clinically useful ones I’ve read recently, and there are a few things in here worth discussing to help you with your ACL progression decision making.
A quick look at who they studied and how
Before getting into the findings, it’s worth knowing a little about the population and setup, because it matters for how you apply this. These were 30 recreationally active athletes, average age around 22, recruited from local clinics in southeast Queensland. Not elite athletes, but the kind of that we are seeing every day.
The big one for graft type: 90% of participants had a hamstring graft. One each had a patellar tendon, quad tendon, and peroneal tendon graft.
So for all practical purposes, this is a hamstring graft study. This is worth pausing on, especially for those of us practicing in the United States. In Australia and much of Europe, the hamstring autograft is still the dominant choice. Over here, we’ve seen a pretty significant shift toward patellar tendon and even more recently quad tendon grafts, particularly at the higher levels of sport.
Both of those graft choices harvest tissue directly from the extensor mechanism, which means your patient is starting rehab with a quad that’s already been cut into. Getting that strength back is genuinely harder and takes longer compared to a hamstring autograft where the quad is structurally intact from day one.
So while the trajectories in this paper are useful, just know that if your caseload is heavy on BTB or QT grafts, you’re probably looking at a slower quad recovery curve than what these numbers reflect. Keep that in mind before you use these benchmarks too literally.
Seven participants also had a lateral extra-articular tenodesis as part of their surgery, and 19 out of 30 had concomitant meniscus injuries. That’s a pretty high rate of combined pathology, which reflects what we see in real practice but also adds some noise when you’re trying to draw clean conclusions about strength and jump trajectories.
On the rehab side, the protocol was not controlled by the research team. All participants worked with a qualified physiotherapist on a criteria-based program that included resistance training, plyometrics, and a graduated return to sport, but the specifics varied by clinician. Testing happened at 3, 6, 9, and 12 months. The drop vertical jump tasks were only introduced at 6 months due to safety concerns, which is a reasonable and familiar decision for anyone who has managed these patients early post-op.
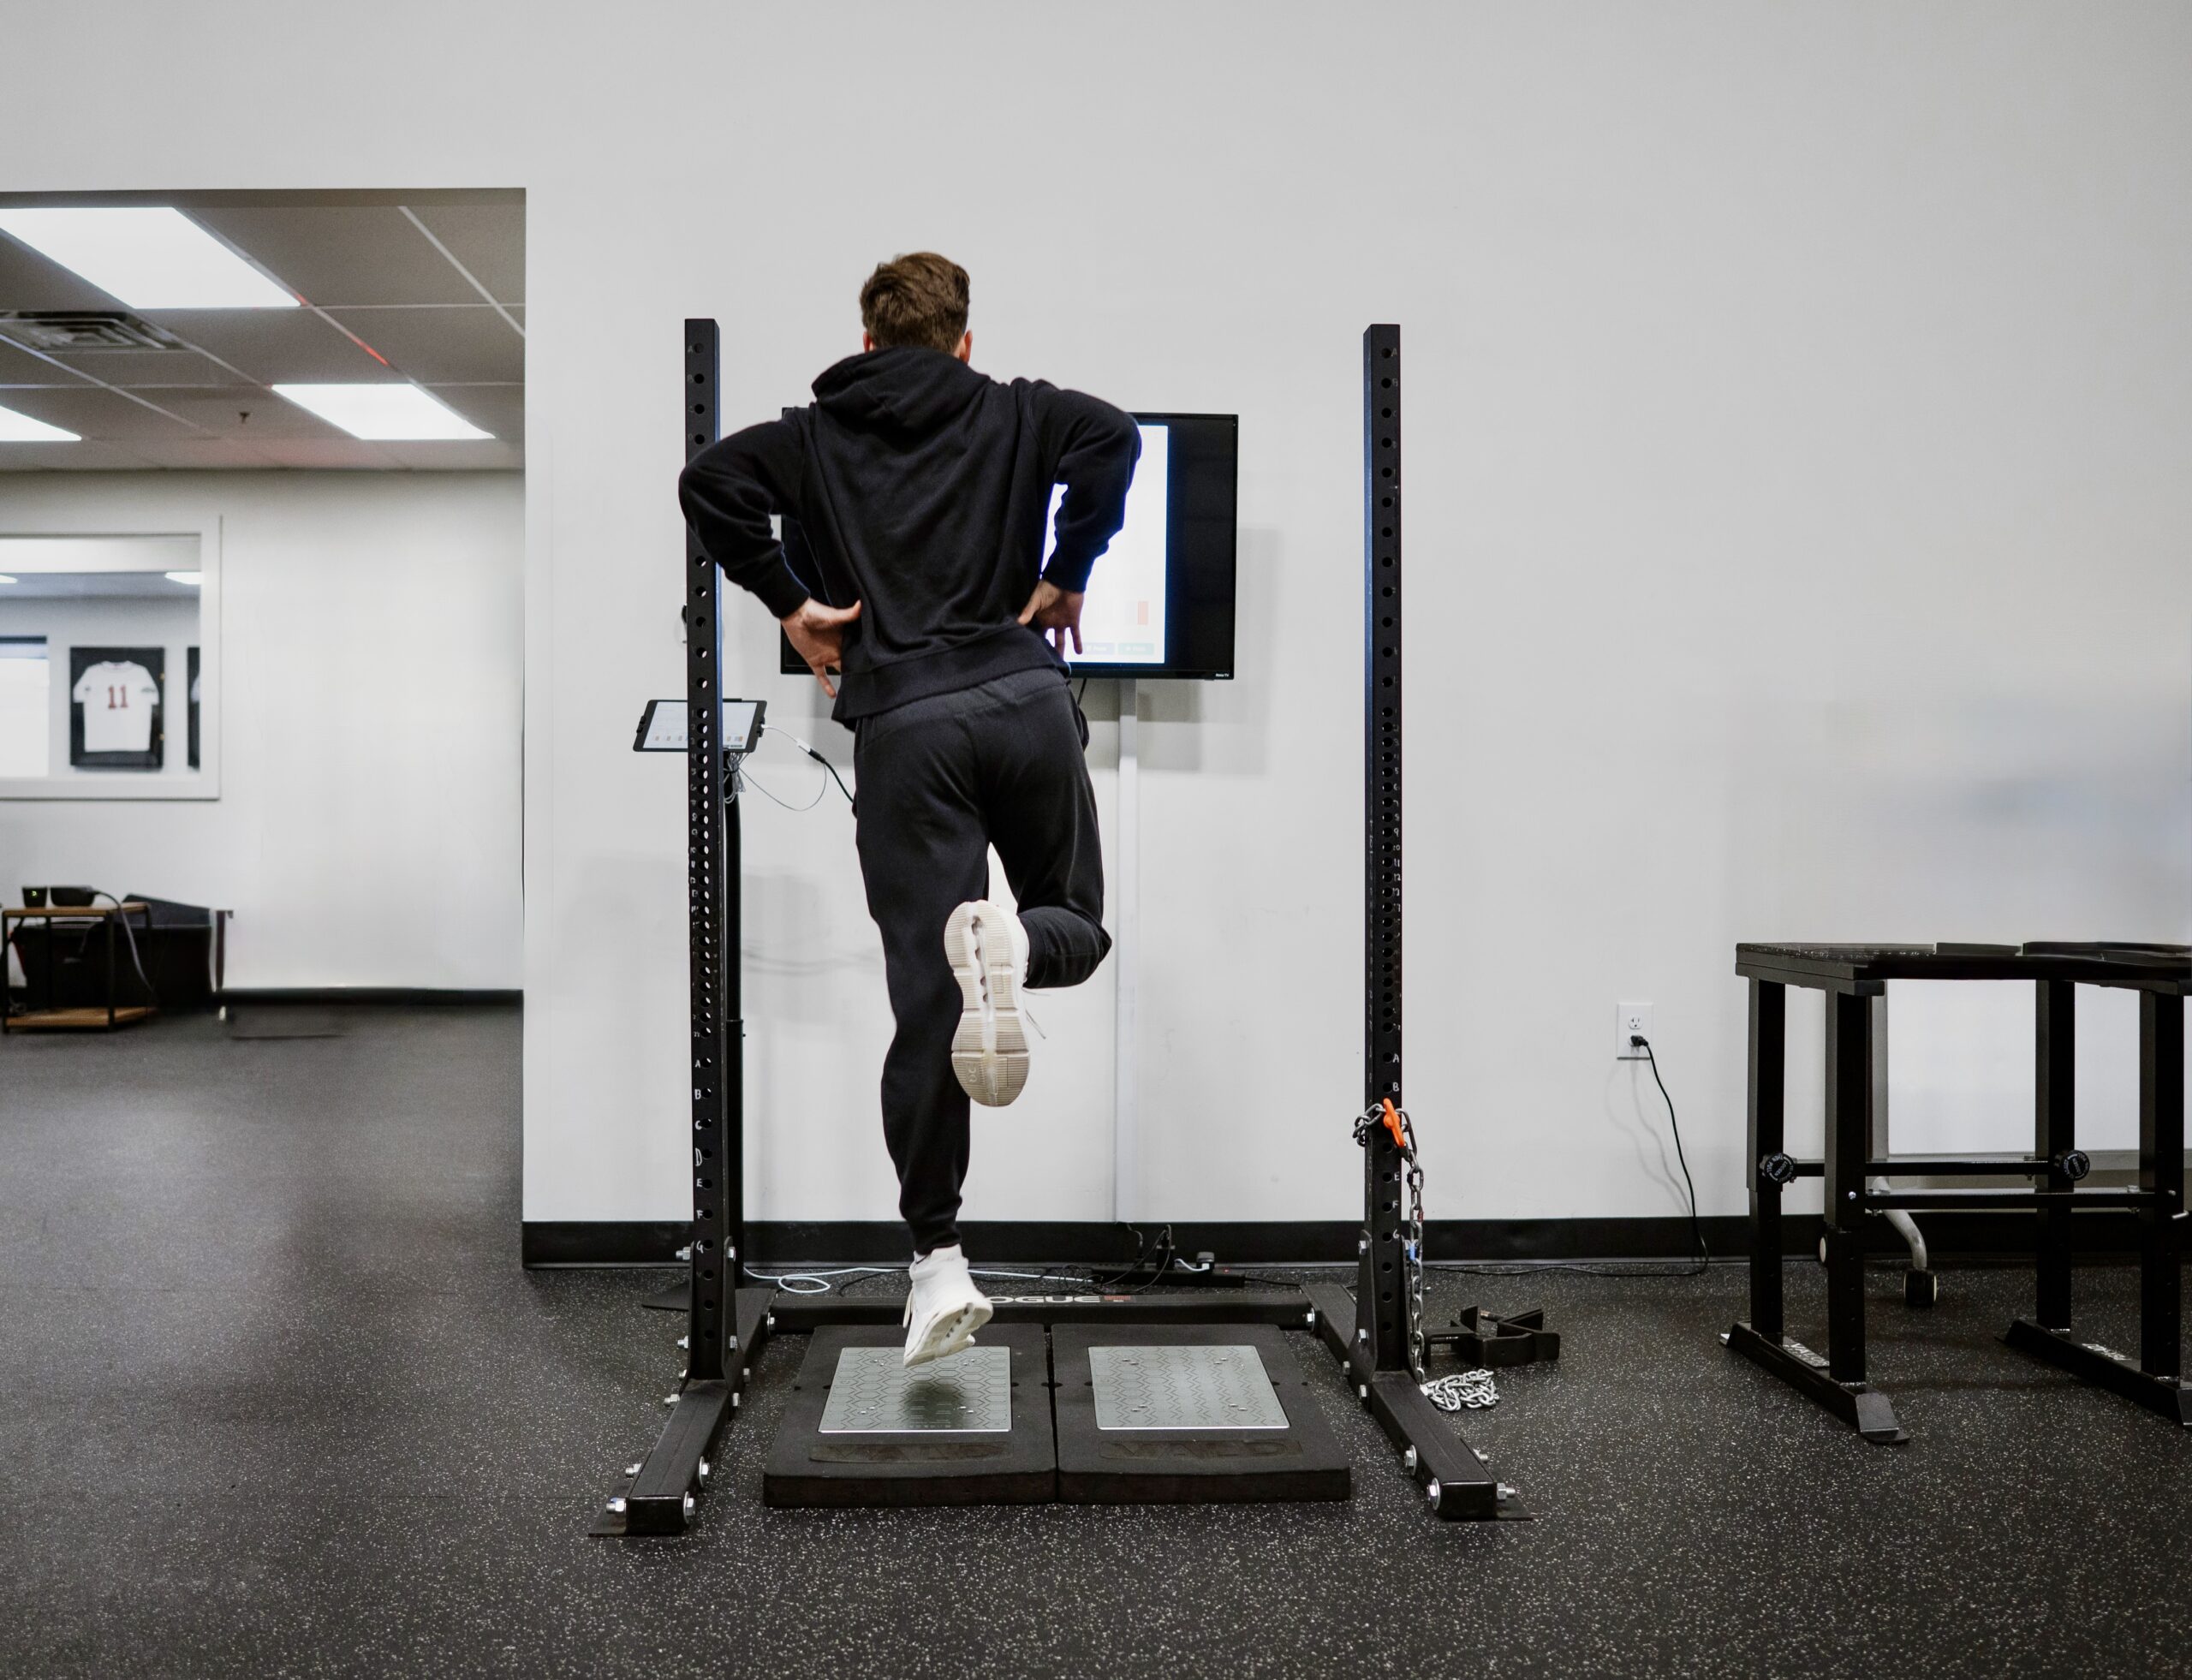
They used VALD equipment throughout (and we do too and highly recommend them), including the ForceDecks for jump testing, the Dynamo for isometric knee extension, the NordBord for eccentric knee flexion, and the ForceFrame for hip strength. Good to know if you’re using the same tools and want to benchmark your own patients against these numbers.
Most of the progress happens early
Strength and jump performance both improve across the full year, but the bulk of it comes in the first 3 to 6 months. After that, things slow down considerably. This isn’t news if you’ve been doing this long enough, but seeing it mapped out in the data is useful.
It’s a reminder that you can’t just keep patients on the same program and expect the same rate of return. The easy gains are gone by mid-rehab and you have to be intentional about what you’re targeting later on.
Also, at 12 months, the surgical limb still showed deficits compared to the other side in most strength and jump measures. That matters for how we talk to patients about timelines, and it should make us more humble about what “finished with rehab” actually means. And again, if your patient had a patellar tendon or quad tendon graft, that deficit is likely even more pronounced than what this study shows.
The two numbers that actually told them something
Out of everything they measured, single-leg countermovement jump height on the involved side was the strongest predictor of psychological readiness to return to sport. The cutoff was 8.4 cm.
Athletes below that threshold had ACL-RSI scores of around 35. Above it, scores jumped to around 72. That’s a massive difference, and it makes a lot of sense clinically. When an athlete can barely get off the ground on one leg, some part of their brain already knows it, even if they won’t say it out loud.
This is exactly why single-leg force plate testing needs to be part of your standard testing, not something you pull out when you happen to have the equipment available. If you can’t do it, befriend a clinic who can and use them!
On the functional side, knee extension strength asymmetry was the best predictor of how patients rated their overall knee function. Greater than 38% asymmetry between limbs was associated with significantly worse KOOS scores throughout the entire rehab process. Not just at return to sport but at the whole time.
Quad strength matters early, it matters late, it matters the whole way through. I’ve said this for years and studies like this keep reinforcing it. And if your patient had their graft taken from the quad or patellar tendon, hitting those strength benchmarks is going to require even more intentional and aggressive quad training from the start. Especially if a QT graft but don’t get me started! I recently talked about QT rehab in a previous blog post.
The symmetry problem nobody talks about enough
This is the part I keep coming back to. Both limbs are changing during rehab, not just the surgical one. The contralateral limb gets stronger and jumps higher over that same 12-month period. So your athlete can hit a 90% LSI and still not actually be at a high level of function. Both sides moved together, the ratio looks fine, but the absolute output on the surgical side is still low.
The authors point this out directly. By around 9 months, single-leg CMJ height on the surgical side approaches where the uninjured side started at 3 months. But there’s still a significant gap between limbs because the other side kept improving the whole time. If you’re only looking at symmetry, you miss this entirely.
This is not a new concept, but this study shows it applies to jump performance too, not just strength testing. Normative data for age, sex, and sport-matched populations would be huge here and something we hope to get soon.
What I take away from this practically and clinically
Return to sport comes down to three things: what the athlete can physically do, how they produce force and move under load, and whether they actually trust the limb. The single-leg jump data gives you a window into all three simultaneously, which is probably why it ended up being the strongest predictor in this study.
Build your testing around absolute single-leg outputs, not just ratios. Jump height, RSI, and force production on the involved side. Isometric quad strength and the asymmetry between limbs. And then actually talk with your patient about how they felt doing it, because that will tell you things the numbers won’t.
If the physical numbers look good but the confidence is still low, you don’t have the full picture. If the confidence is high but the outputs are still lagging, same problem. You need both. And if you’re only collecting one of those data points at return to sport, you’re guessing.
The bottom line from this paper is pretty simple: physical capacity, force production, and psychological readiness all need to be part of the picture. If one of those is off, they’re probably not ready, even if everything else looks fine on paper.
Reference: Dutaillis B, Collings T, Bellinger P, Timmins RG, Williams MD, Bourne MN. Time-course changes in lower limb strength, vertical jump metrics and their relationship with patient reported outcomes following anterior cruciate ligament reconstruction. Knee Surg Sports Traumatol Arthrosc. 2025;33:2684-2699.
Leave a Reply